Census Data
Just Released and Available for Public Use
In our fourth installment since establishment of this service, the Mulholland Institute is happy to announce the availability of the 2014 and 2015 American Community Survey, United States Census data for the San Fernando Valley Census County Division.
![]()
Background
More than a decade ago, Mulholland Institute launched an effort to create a San Fernando Valley Statistical District. The need was great, with our thousands of non-profits, government offices, businesses and community organizations seeking more reliable data on this place called the San Fernando Valley. These data have important applications in planning, land use, transportation, grant seeking, marketing, and the overall physical, social and economic future of the Valley region.
In the process, the institute also obtained approval from the City and County of Los Angeles, and the State of California to generate breakouts of Valley data at those levels as well.
The San Fernando Valley has been added to the many major geographies throughout the United States for annual demographic updates through the American Community Survey program. We have also succeded in establishing the San Fernando Valley Council of Governments (SFV COG), a Joint Powers Authority of the citiies of Burbank, Glendale, Los Angeles, San Fernando and Santa Clarita. Through the excellent work of the COG we have established the San Fernando and Santa Clarita valleys as a planning subregion of the Southern California Association of Governments (SCAG), and as a planning subarea for the Los Angeles County Metropolitan Transportation Authority (METRO).
SCAG-Sponsored Northeast Valley Strategy
Now the Real Work Begins
[Download Report]
The Northeast San Fernando Valley Sustainability & Prosperity Strategy was developed in FY 2015-2016. It sets the stage for an ongoing, highly-ambitious endeavor. As populous as the Northeast Valley subregion is, there is a tendency for it not to be recognized as a quarter of the fifth largest metropolitan area in the United States--the San Fernando Valley. The development of the strategy by Mulholland Institute was sponsored by a grant from the Southern California Association of Governments (SCAG). The strategy envisions a subregion with compact centers connected by convenient public transit. This allows residents to live closer to work, school, shopping and other destinations. Neighborhoods are made more walkable and safer for bicyclists. Goods can flow more freely, fueling economic growth. Housing in the subregion should be adequate to meet the demands of a growing population and balanced with available jobs and careers.
With better-connected communities, there are more choices for travel, commerce and economic development. Residents are able to enjoy more opportunities to advance themselves educationally and economically. People from diverse neighborhoods across the region can share in the benefits of an enhanced quality of life. Shopping, dining and recreation join with a full array of other amenities to make communities more complete and livable. With more transit alternatives, air quality is improved and the greenhouse gas emissions are reduced. People across the subregion benefit from more choices for getting around, and with those choices come opportunities to live healthier, more economically secure, and higher quality lives. This new stategy is built upon SCAG’s 2016 Regional Transportation Plan/Sustainable Communities Strategy
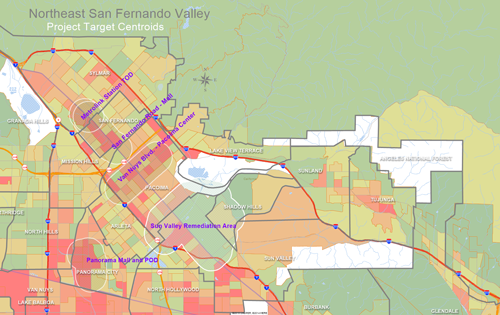
Area Characteristics
The Northeast Strategy covers an area the size of Cleveland, with an even greater population--half a million residents. Target communities include the City of San Fernando, and Community Plan areas of the City of Los Angeles: Arleta-Pacoima, Mission Hills-Panorama City, Sun Valley-La Tuna Canyon, Sunland-Tujunga-Lakeview Terrace-East La Tuna Canyon, Sylmar; and selected unincorporated areas of Los Angeles County.
At the end of WWII, this once-rich farmland of olives and citrus gave way to the suburban middle class, and was absorbed into the vast urban-suburban landscape of Los Angeles. Owing to the modesty of the housing, and proximity of heavy industry and aggregates, the Northeast Valley became the de facto center of affordable housing for the region. Unfortunately, some of the same industries and activities that provided post-war job opportunities, also had a dramatic effect on the quality of life and residents of the region. This new strategy provides a road map for a community renaissance in the Northeast San Fernando Valley.
[SCAG 2016 Regional Transportation Plan/Sustainable Communities Strategy]
COUNTY VOTERS ADOPT MEASURE M
Mobility Matrices Pioneered by Mulholland Institute
and San Fernando Valley COG
Focus on Geographic Equity
Prior to 1980 the County of Los Angeles suffered from a lack of public transportation options. In the 36 years since, the taxpayers of the region have successfully established a number of transit and transportation funding initiatives: Proposition A in 1980, Proposition C in 1990, Measure R in 2008, and most recently Measure M in 2016. The big difference in 2016 is the fact that the San Fernando Valley now has (since 2010) a voice and a Council of Governments comprised of subregional cities and elected officials. Further, most Valley elected officials and civic organizations were united in this round to advocate for proper representtation in any future funding formulas. [Details]
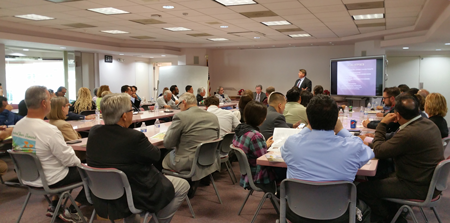
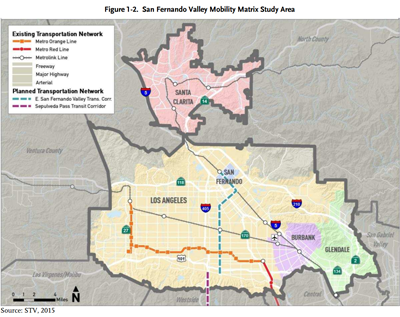
Key to this was our recommendation to METRO to establish Mobility Matrices for each COG subregion to assure geographic equity and allow for consistency in developing and evaluating projects. Thus, the COG subregions have been given an important role in funding and local implementation of Sustainable Communities Strategies in real-world situations. [Details]
The matrices evaluate corridors (e.g., highway, arterial, rail, bicycle) establishing the framework that was adopted for Measure M transportation improvements.
Mobility Matrix Presentation PowerPoint - Download
Links to the Measure M Documents
SFV Region Mobility Matrix Report
SFV Final Project List
Executive Summary
Appendix A - Meeting Matrix
Appendix B - Baseline Conditions Report
Appendix C - Methodologies
Appendix D - Project Detail Matrix
(Updated on 3/13/15)
Link to City of Los Angeles Historical Annexation Map 1781 through 1916